

Allowable and Design Stresses
Most of marine engineering failures are related with allowable and in service stresses. Allowable stresses are determined by recognizing which of the various possible failure modes apply to the problem being analysed. The strength of the material generally is then utilized from tabulated test data.
Ultimate Strength Su – when the part will crack and fracture. Corresponding on a tensile test machine, to the load when the part breaks. As a rule of thumb for steel, a rough approximation is about 500 times the Brinell hardness number (BHN).
Yield Strength Sy – when the part is stretched in such way that the material will not return to its original shape. In a tensile testing machine, a ductile part would “neck down.” If interference or fit-up were a problem, this would be an important failure mode. In general, it’s a good idea not to design near the yield strength.
Shear Strength Ss Shafts fail in shear when there is an excessive torque overload. Shear strength data are more difficult to find. If data are unavailable, use the maximum shear theory:
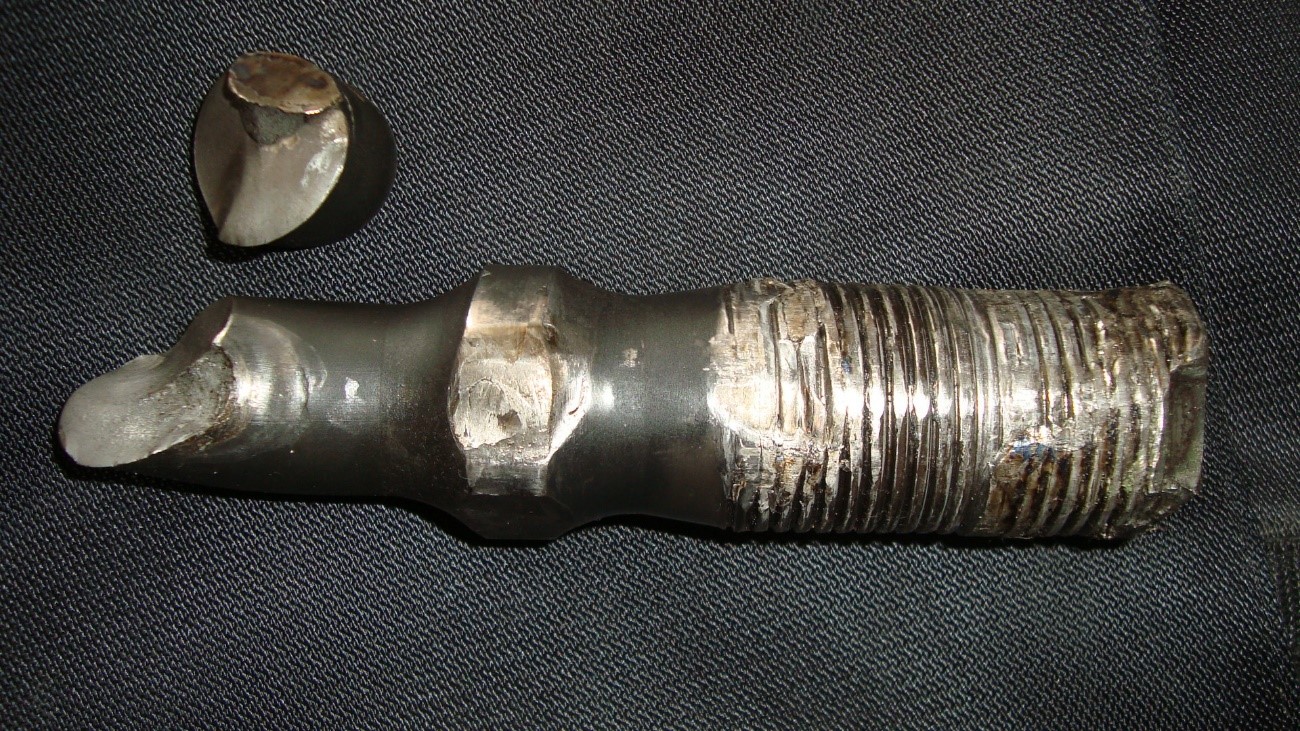
Figure 1 – Damage Stud Due to Cyclic Stress
Fatigue Due to Cyclic Loading
The endurance limit for steel and many metals is important. If the part can cycle through 10 million stress cycles at a given stress level, it can be said with some authority that the part will not fail in fatigue no matter how many more cycles it undergoes.
Figure 3 shows the endurance limit for steel and how it is determined. The material is placed in a test machine and undergoes cyclic stress at a given level and run to failure. Note that after 107 cycles there is an upper stress at which the material can be cycled and no failure occurs. This is called the endurance limit and can be used to determine if a part will fail in fatigue. In reference to Figure 3, if we put 70,000 lb/in2 bending stress on a shaft, we would expect it to fail. However, a failure would not be expected at less than 50,000 lb/in2 no matter how many cycles it undergoes. Some materials do not have an endurance limit as just defined and might behave more as the straight line shown.
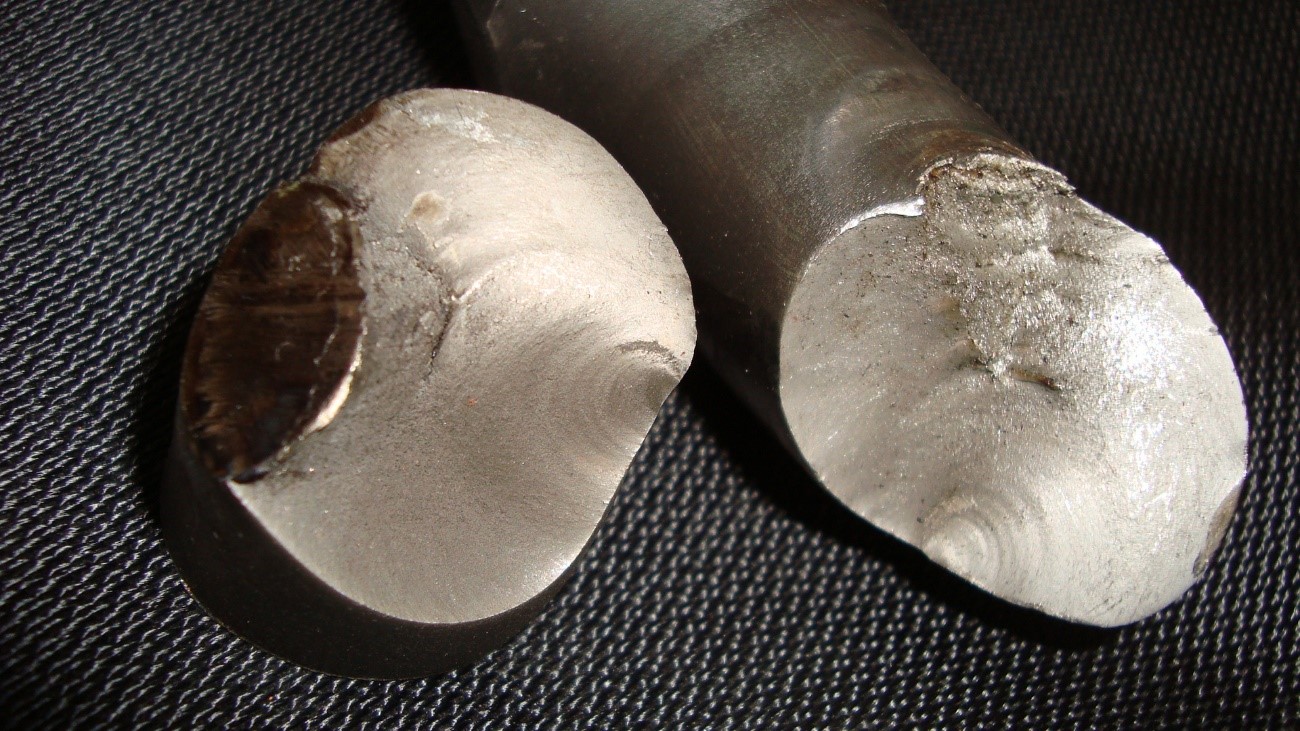
Figure 2 – Beach marks of the stud
When only static stresses are to be considered, the acceptability of the calculated stresses could be determined easily. All one would have to do is to see if a stress value exceeded one of the failure criteria. But what happens when a fluctuating stress is superimposed on a static stress? The endurance limit alone is of little use. For this type of failure, a diagram called the modified Goodman is useful and is shown in Figure 4.
The steps for construction are simple once the stresses have been calculated.
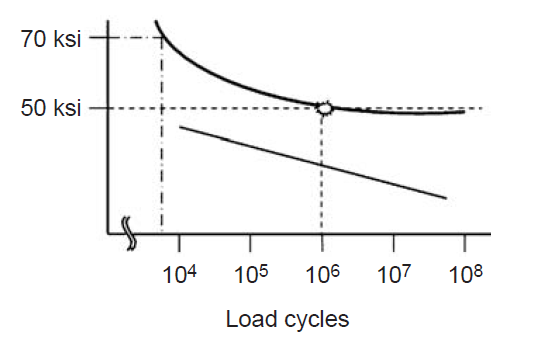
Figure 3 – Endurance limit for steel
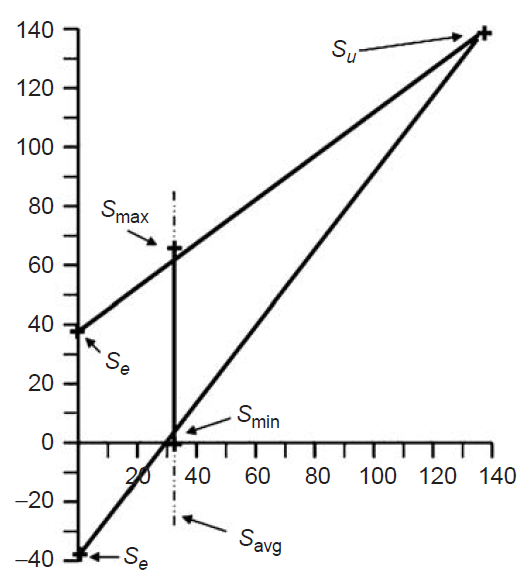
Figure 4 – Modified Goodman diagram
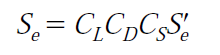
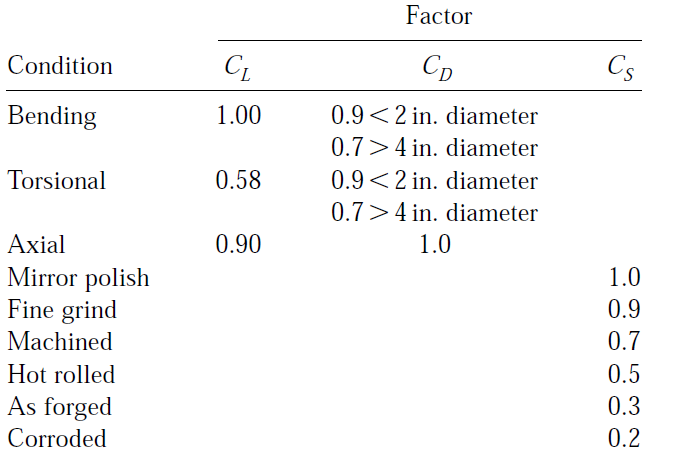
When data are not available and a quick check on the fatigue data is needed, the following can be used for steel at 106 cycles. Se is the actual polished rotating bending specimen endurance limit. When that is not known, an estimate for steel is one-half the ultimate tensile strength. The surface finish factor CS data shown in Table 1 is for steels with tensile strengths in the range 100,000 to 200,000 lb/in2:
Normal preference is to put the stress concentration factors on Smax and Smin. However, with highly corroded surfaces, one can neglect any stress concentration factors in a first pass.
It is important to realize that almost 90% of the fatigue life goes into producing a crack. Once the crack is established, not much remaining life is left. That is why the various surface finishes so greatly affect the endurance limit.
Surface defects are produced which reduce the fatigue life of shafts. Figure 5, a graph of the fatigue life remaining when a crack is present, illustrates this point. Fretting corrosion, which is a form of wear, results in small cracks which greatly reduce the fatigue strength and may cause shaft failures. The graph illustrates a cyclic axial stress on a crack in a steel bar 1 in. thick. Life is considered to be complete when the initial crack grows through the bar. The graph illustrates that an initial crack of any size can drastically reduce the fatigue life of a part. The larger the initial crack, the shorter the life.
Table 1 – Endurance Limit Factors
For example as a classification rule for cracks encountered on propeller shafts, if a crack is encountered with a depth bigger than 0.001 of its diameter the shaft should be scrapped.
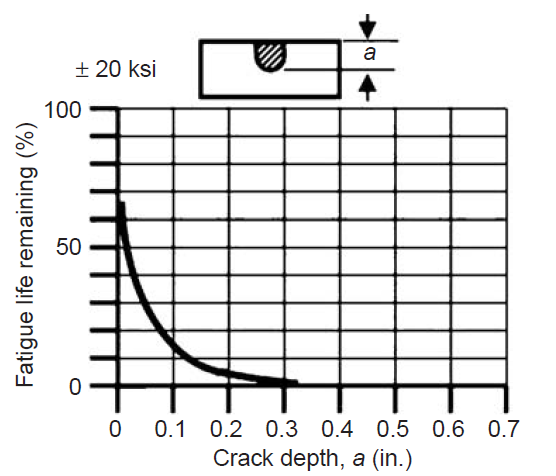
Figure 5 – Fatigue Life Remaining
1 comment on “Allowable and Design Stresses”
With reference to the 1st paragraph, it states that if a component can endure more than 10×10^6 stress cycles we have infinite life?
That is true but only if the endurance stress exceeds the working stress amplitude.